Alan Couzens, M.S. (Sports Science)
See the orignal article on Alan’s website HERE Aug 19th, 2015
As key races approach, athletes get understandably antsy. The mind starts to run with thoughts on ‘what’s missing’ from the training plan. This isn’t helped by all of the mixed messages in the media and popular training texts.
Am I doing enough “sweetspot training”?
Is that Zone 3 stuff really ‘no mans land’?
Should I be doing more work at FTP to boost my ‘ceiling’?
Is my training sufficiently ‘polarized’?
Incidentally, it’s impossible to answer yes to all of the questions above!
Actually, forget the confusion provided by books and the internet, science is pretty confused too! You’ll find just as many studies touting the benefits of very high intensity training as you do studies promoting the benefits of low intensity aerobic work. So what’s the answer? Where can we go to get an honest, unbiased assessment of what methods actually work in the ‘real world’? The journals?
Scientific studies continue to be limited by 2 significant constraints – time (i.e. duration of the study) and the sample (both the size and the specificity of the sample). The first is the most significant problem. If I’m dealing with an athlete over a horizon of multiple years, how relevant is an 8 week study? If an athlete improves rapidly over the course of 8 weeks but then plateaus and regresses beyond that, how much ‘real world’ value does the protocol really have? Similarly, if the protocol ‘works’ on novice college aged subjects (as most protocols do), how valuable is it to my sample of serious endurance athletes with a long training history?
Fortunately, if we are willing to cast an eye from the restrictive domain of scientific studies, there is a huge amount of ‘real world’ data collection happening right under our noses! Just about every serious triathlete I know has a Garmin, a power meter & a proverbial mountain of training files just waiting to be ‘mined’.
Yes, that business buzzword of the moment – ‘data mining’ can equally be applied to the world of endurance sports. This is my latest obsession and I have a lot to learn (and a stack of books to read – as recommended to me by friends and Amazon’s cosine similarity algorithm 🙂 but, right from the get-go, the direct practical benefit of applying the simplest elements of big data analysis to the huge amount of training data we all collect in endurance sports is readily apparent and exciting! Let’s start with a definition of just what we mean by “data mining”?
From Wikipedia…
“The overall goal of the data mining process is to extract information from a data set and transform it into an understandable structure for further use.”
The keys here are the extraction of information (rather than the endurance athletes habit of just collecting data) and putting that information to future use, i.e. analyzing the information and using it to make better training decisions!
This higher level task of making the best decisions for an individual athlete based on data can be assisted by the next step in information technology – machine learning – where we use the computing power of our mechanical friends to help us compare individual athlete data against patterns that we observe within the global data set to help us make better decisions for that particular athlete.. but that’s a topic for the future. Let’s first look at just mining the entirety of the ‘big data’ to help us answer some equally big questions…
If you’re an athlete with a Garmin fetish, chances are you already have a pretty impressive data set just waiting to be mined, understood & put to future use. If you’re a coach, multiply that by a large factor!
I know this because when I started to play around with coding, abut 2 years ago, I wrote a php script to pull training file data from the athletes I coach into a MySQL database. So far that database has 22,756 files and is growing by the day! OK, so it may not be ‘big data’ in the Amazon sense but, as a humble tri coach, making sense of that amount of data can be daunting! The big question becomes, what do we do with all of those files? Or, more productively, how can we, as coaches, make practical use of the huge datasets that we have (in databases or Training Peaks or WKO+ or living on our harddrive somewhere) to help us answer some very ‘real world’ coaching questions and enable us to make better, evidence-based, decisions for our athletes?
There’s no better place to start the process of using data to help us better understand the big questions than with one of the biggest questions of all – “Which is more important, volume or intensity?” Of course, there are all kinds of levels to this question – for what event? Over what time frame? For what type of athlete? All of these factors can be incorporated into a comprehensive model that we can apply predictively. However, all good models begin with a global understanding of the question so let’s start by looking at the whole data set. What do my 22,000+ files have to say about the relative impact of volume and intensity on aerobic fitness?
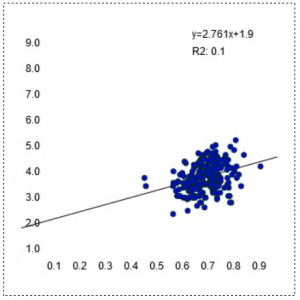
Each data point in the charts below contains the average of all session data for a given athlete over a 4 week block of training (i.e. ~90 sessions worth of data per data point). These charts (and the regression equations) are linked to my database and will continue to update real time as more files are added (i.e. more & more blue dots will keep popping up until the chart becomes a sea of blue 🙂 so check back to see how the model changes as more data is added. But what’s the data’s current stance on the perennial volume vs intensity debate? Let’s first look at the relationship between average training intensity (I.F.) over the course of a block and aerobic fitness (as measured by Functional Threshold Power)
Intensity: I.F. vs FTP (w/kg)

Perhaps contrary to popular belief, the mean Intensity Factor of the training actually has a very weak correlation with aerobic fitness (FTP). You can see this in the very round scatterplot and the low R2 number. Providing a certain I.F. is reached (~0.6), we see high fitness occurring at a range of intensities. We see athletes with very high FTP numbers training at relatively low average I.F. numbers – athletes with FTPs of 5w/kg accumulating training blocks in the 0.6-0.65 region. Similarly we also see relatively unfit athletes – folks with FTPs of 3w/kg accumulating blocks of very intense training at or above an I.F. of 0.8. While there may be a hint of a positive relationship between intensity and FTP it is certainly not a strong one. Put another way, if we were putting together a model that predicts an athlete’s FTP, the mean intensity of their training would only represent a very small part. Bottom line: The data suggest that ramping up the intensity is not a reliable way to improve fitness, especially if it results in a loss of volume….
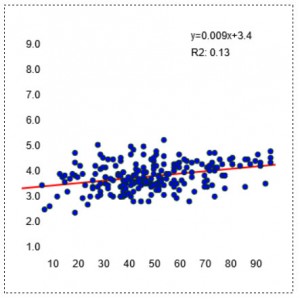
Volume: Monthly hours vs FTP (w/kg)

The relationship between the simplest number of all – pure volume (training hours per month) and aerobic fitness (FTP) is actually more reliable. Most people who train a lot tend to be very fit. Not an earth shattering revelation but a useful reminder in a world full of ‘time-crunched’ training plans. If you really want to have a high FTP, plain old monthly volume isn’t a bad place to start. In this data set, the vast majority of athletes with an FTP north of 4w/kg (i.e. 300W for a 75kg athlete) were training more than 60hrs per month. This relationship between increased monthly volume and increased FTP, while still only moderate, is significantly stronger that the relationship between fitness and training intensity.
CTL (TSS/d) vs FTP (w/kg)

However, the strongest, most reliable correlate of FTP comes in the form of Chronic Training Load – with a near linear relationship between CTL & FTP at least up to a CTL of ~150: CTL of 50 ~= FTP of 3.5w/kg, 100 ~= 4.0, 150 ~=4.5.
This builds on top of that moderate relationship between monthly volume and fitness that we saw above in that it brings in 2 additional factors…
1. Consistency – CTL incorporates a longer time frame than one month of training. Using default constants, it represents training load over an ~5 month time frame. Unsurprisingly, this data suggests than an athlete who strings together ~5 months of solid load is going to be fitter than an athlete who puts in one month of impressive volume.
2. Season ‘pacing’ – CTL exponentially weights the load closest to the report date. Therefore, it rewards athletes who ‘pace’ their season correctly & put down their greatest training loads close to their event. In other words, not only does the data suggest that an athlete with 3-5 months of solid training is going to be fit but also that the athlete who adopts a progressive approach and has his highest load in the month preceding the FTP assessment is going to be in a better position than the athlete who, while having the same long term average load is the proverbial ‘February rock star’ who achieves his peak load a long way out from the ‘test’ date.
So, there you have it, the data suggests the surest route to a higher level of aerobic fitness is to raise that CTL. Now you can sleep soundly, both from the extra training load that you’re doing 🙂 and in the knowledge that all of the small stuff really is small stuff. There really are no shortcuts or substitutes for a well thought-out, long term progression of your training load
#######
Hopefully this data provides some good real world context to put some of the ‘methodology hype’ in perspective. Furthermore, I hope it prompts you to begin ‘mining’ your own data for patterns that add to our collective understanding and enable us to make better, objective, evidence-based decisions as coaches and athletes.
Train Smart,
AC


